
This is a very short post about two of the most basic metrics in the Information Theory
- is a measure of the amount of uncertainty in the (data) set S (i.e. entropy characterizes the (data) set S).
- in other words, it is the average amount of information contained in each message received (message here stands for an event, sample or character drawn from a distribution or data stream)
- it characterizes the uncertainty about our source of information (Entropy is best understood as a measure of uncertainty rather than certainty, as entropy is larger for more random sources)
- a data source is also characterized by the probability distribution of the samples drawn from it (the less likely an event is, the more information it provides when it occurs)
- it makes sense to define information as the negative of the logarithm of the probability distribution (the probability distribution of the events, coupled with the information amount of every event, forms a random variable whose average (expected) value is the average amount of information (entropy) generated by this distribution).
- because entropy is average information, it is also measured in shannons, nats, or hartleys, depending on the base of the logarithm used to define it
Math interpretation:
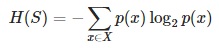
![]()
![]()
Python implementation:
# Calculates the entropy of the given data set for the target attribute.
def entropy(data, target_attr):

    val_freq = {}
    data_entropy = 0.0

    # Calculate the frequency of each of the values in the target attr
    for record in data:
        if (val_freq.has_key(record[target_attr])):
            val_freq[record[target_attr]] += 1.0
        else:
            val_freq[record[target_attr]]  = 1.0

    # Calculate the entropy of the data for the target attribute
    for freq in val_freq.values():
        data_entropy += (-freq/len(data)) * math.log(freq/len(data), 2)

    return data_entropy
- is the measure of the difference in entropy from before to after the data set S is split on an attribute A
- in other words, how much uncertainty in S was reduced after splitting data set S on attribute A
- it is a synonym for Kullback–Leibler divergence (in the context of decision trees, the term is sometimes used synonymously with mutual information, which is the expectation value of the Kullback–Leibler divergence of a conditional probability distribution. The expected value of the information gain is the mutual information I(X; A) of X and A – i.e. the reduction in the entropy of X achieved by learning the state of the random variable A. In machine learning, this concept is used to define a preferred sequence of attributes to investigate to most rapidly narrow down the state of X. Such a sequence (which depends on the outcome of the investigation of previous attributes at each stage) is called a decision tree. Usually an attribute with high mutual information should be preferred to other attributes).
Math interpretation:


Python implementation:
# Calculates the information gain (reduction in entropy) that would result by splitting the data on the chosen attribute (attr).
def gain(data, attr, target_attr):

    val_freq = {}
    subset_entropy = 0.0

    # Calculate the frequency of each of the values in the target attribute
    for record in data:
        if (val_freq.has_key(record[attr])):
            val_freq[record[attr]] += 1.0
        else:
            val_freq[record[attr]]  = 1.0

    # Calculate the sum of the entropy for each subset of records weighted by their probability of occuring in the training set.
    for val in val_freq.keys():
        val_prob = val_freq[val] / sum(val_freq.values())
        data_subset = [record for record in data if record[attr] == val]
        subset_entropy += val_prob * entropy(data_subset, target_attr)

    # Subtract the entropy of the chosen attribute from the entropy of the whole data set with respect to the target attribute (and return it)
    return (entropy(data, target_attr) - subset_entropy)
Cheers!
Resources:
- Information Theory definition on Wikipedia (http://en.wikipedia.org/wiki/Information_theory)
- Entropy definition on Wikipedia (http://en.wikipedia.org/wiki/Entropy_(information_theory))
- Information gain definition on Wikipedia (http://en.wikipedia.org/wiki/Information_gain_in_decision_trees)
- Andrew Moore’s tutorial slides on Information Gain (http://www.autonlab.org/tutorials/infogain11.pdf)
Tagged: Machine Learning


Thanks very much for the explicit labeling of variables in those equations.
Could not get what I () stood for in all other articles on the web.
Cheers!